“What gets measured gets improved.” Peter Drucker would say. I know, having studied humanities many of you consider yourselves quite far from everything that deals with numbers and measurements. But think for a moment: is this a good excuse to prevent your business’s boost? Are you indeed aware how many students your school usually has on picky seasons? Have you ever thought you actually have picky seasons? Do you know which courses are most demanded, and what is the attendance rate among your students? Hmm, too many questions. Let’s find out which key performance indicators to pay attention to in order to increase your training center’s profitability.
Your school performs thanks to students, teachers and administrative stuff. They are game changers, and you should be able to measure their execution in their domains. We’ll go through all of these three “components” starting with students as the most important ones.
Student satisfaction rate
How do you know you’re a good language school from student perspective? Actually, there are two metrics to understand students’ satisfaction rate:
- student attendance
- student progress
Marking attendance in Tutor LMS, you’ll find out how many active students you have in your school at the moment and compare the results with previous periods and of course forecast the future ones.
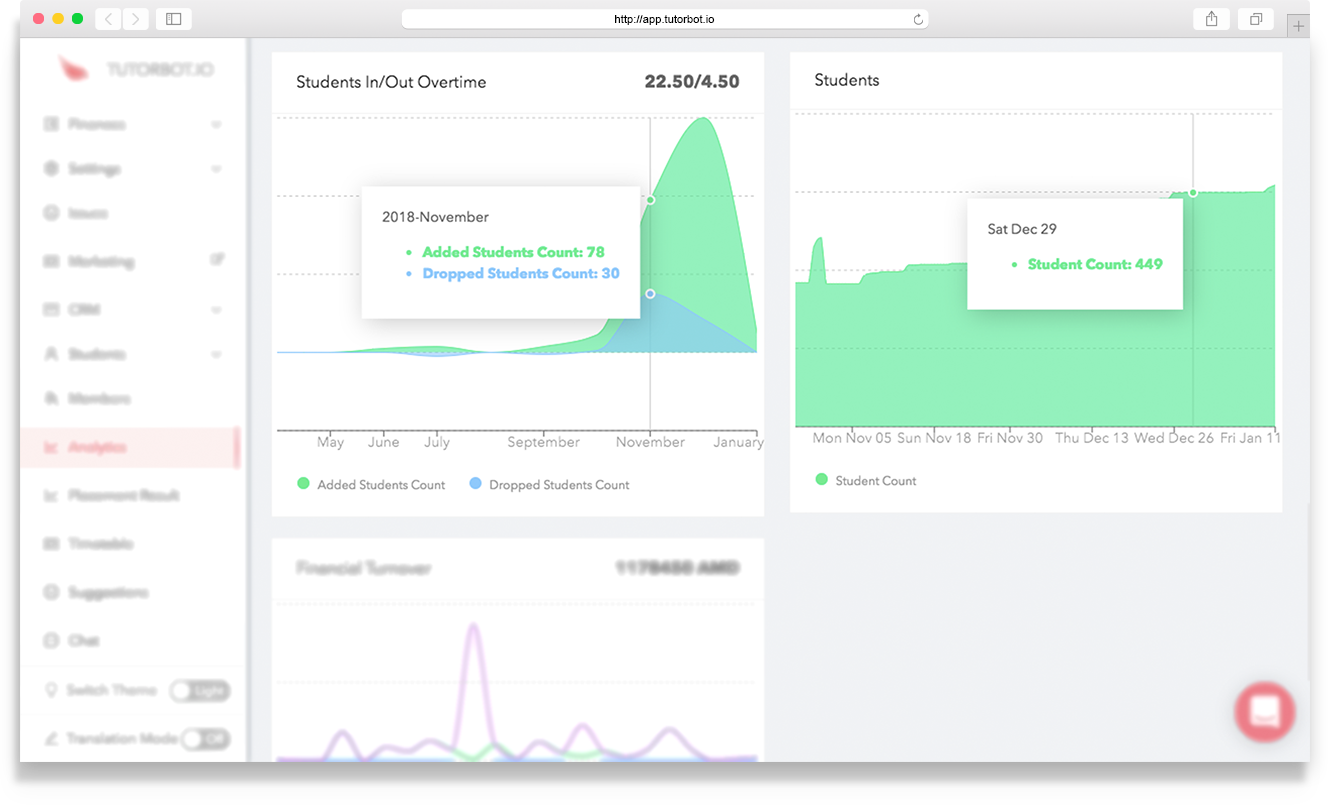
The chart above illustrates the number of active students for the specific period in correlation with those ones who dropped their classes. As you see, the rate of dropped students is quite high for this given period. Well, this can result in the fact that November is a pre-holiday month and everybody gets ready for the year-end. Having this information in mind, you’ll probably run a pre-Christmas campaign to increase students’ lead next year (as our beloved school has done. See the same chart).
As I mentioned, students’ success is to be measured not only by knowing how eagerly they attend classes, but also how they progress during the time.
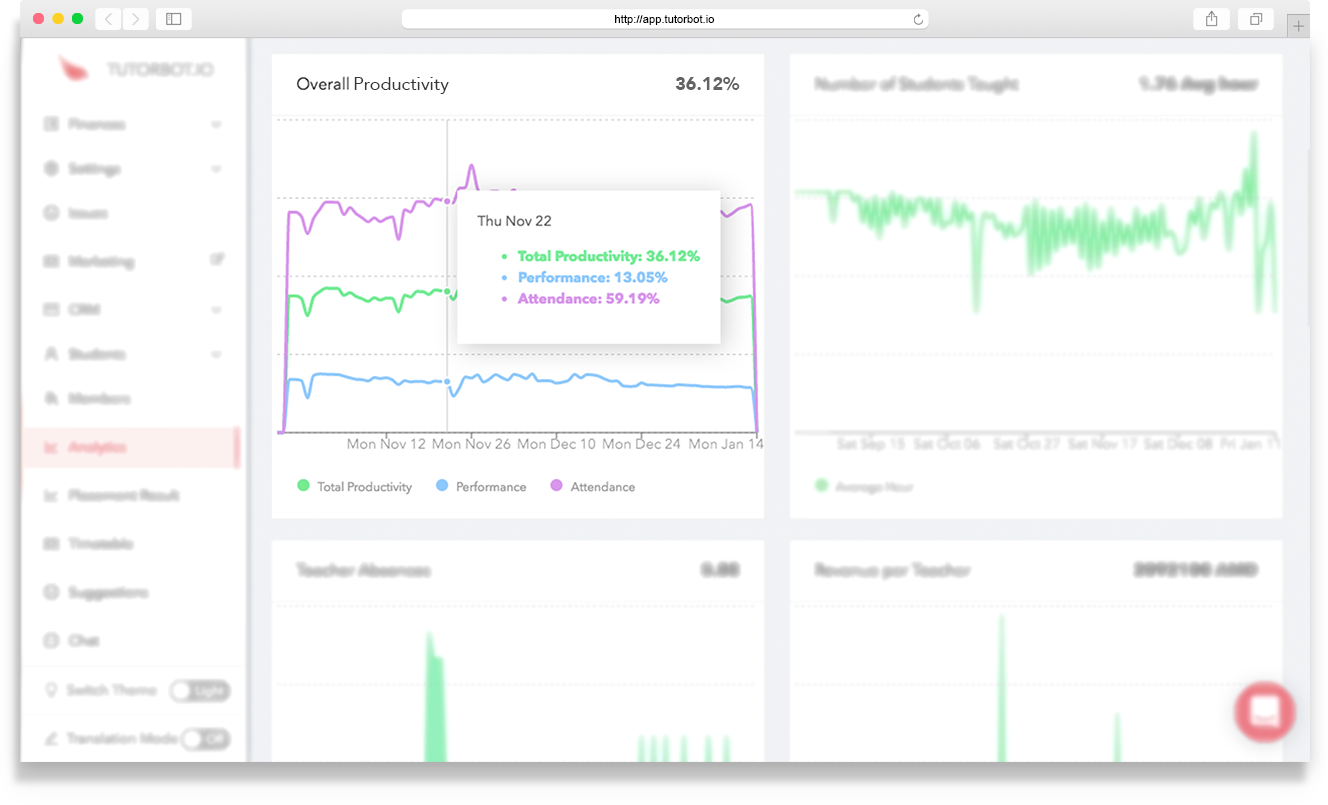
In the chart below you see “performance” as a second metric to build out groups’ productivity. Performance is based on various factors which we collect and analyse for each student individually. This metrics are great help to teachers and class managers to re-order and re-levelize students within groups. If, for example, a student shows high attendance but the performance is bad, they should, probably, change the group to the lower one.
In this way, we draw the productivity rate, which, as you have already understood, is the relation between group attendance and group performance.
Teacher performance
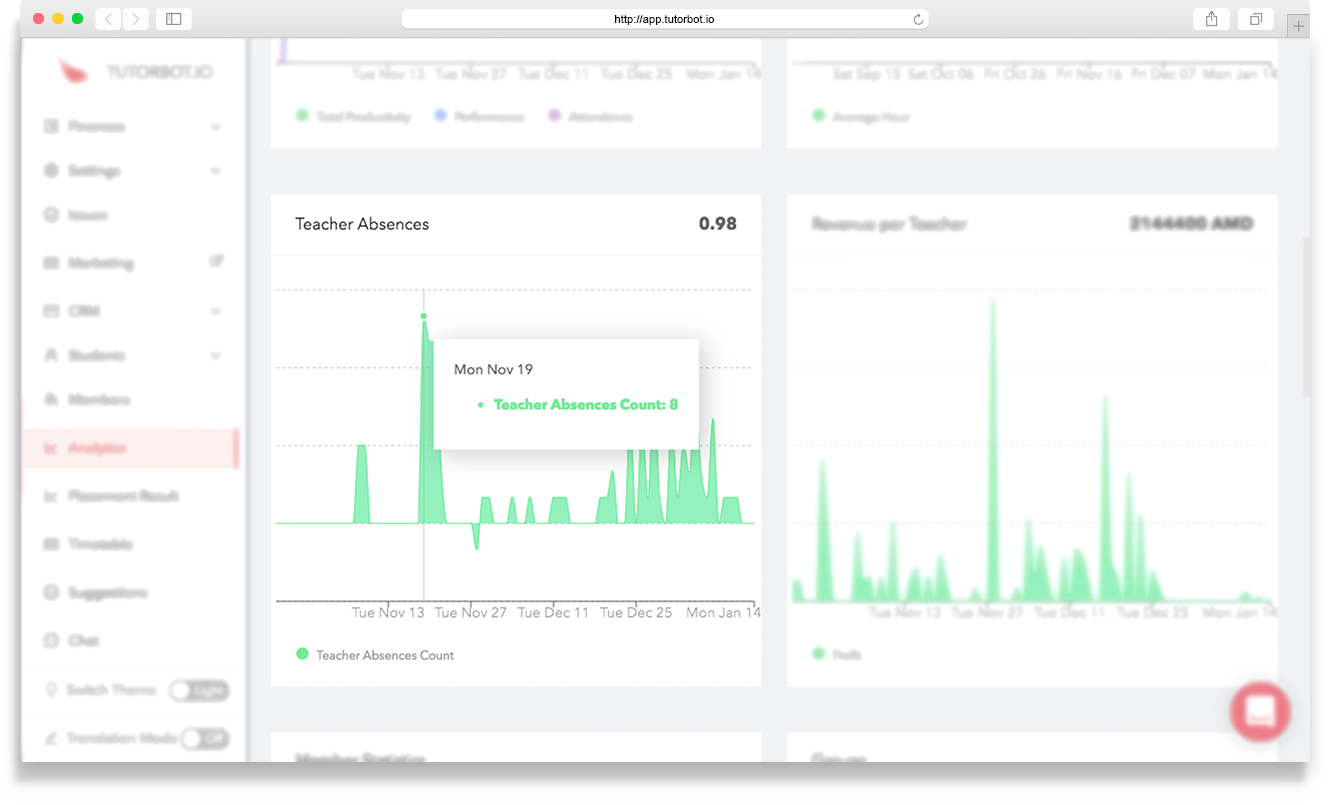
Teachers are cornerstones responsible both for success and failure of your language school business. Group’s productivity is, of course, a reliable indicator to show how well a teacher has performed, but it is not the only one. The graph below represents teachers’ attendance in numbers. Starting with the bottom line and identifying when and how often teachers are absent at your school (may it be health or organisational stuff-related) you’ll be able to take steps to prevent unpleasant consequences. You might think of having backup teachers or rescheduling the syllabus.
General and financial management
Another important criterion to make you sure you run your business smart enough is your stuff: the faster it grows, the sharper your business boosts. Think yourself: If you hire more and more teachers and management personal, it means you grow. Here is the chart to demonstrate how to keep a track on your personnel expansion.
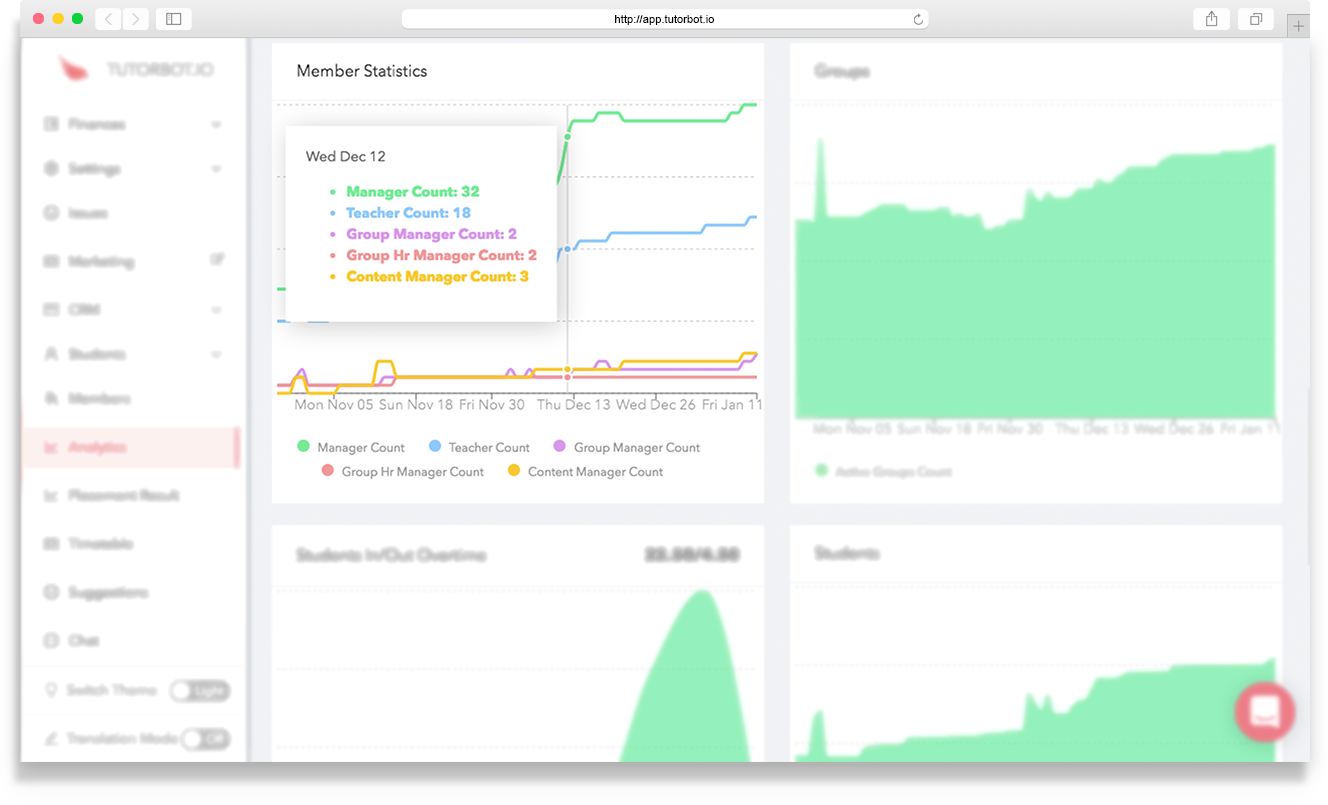
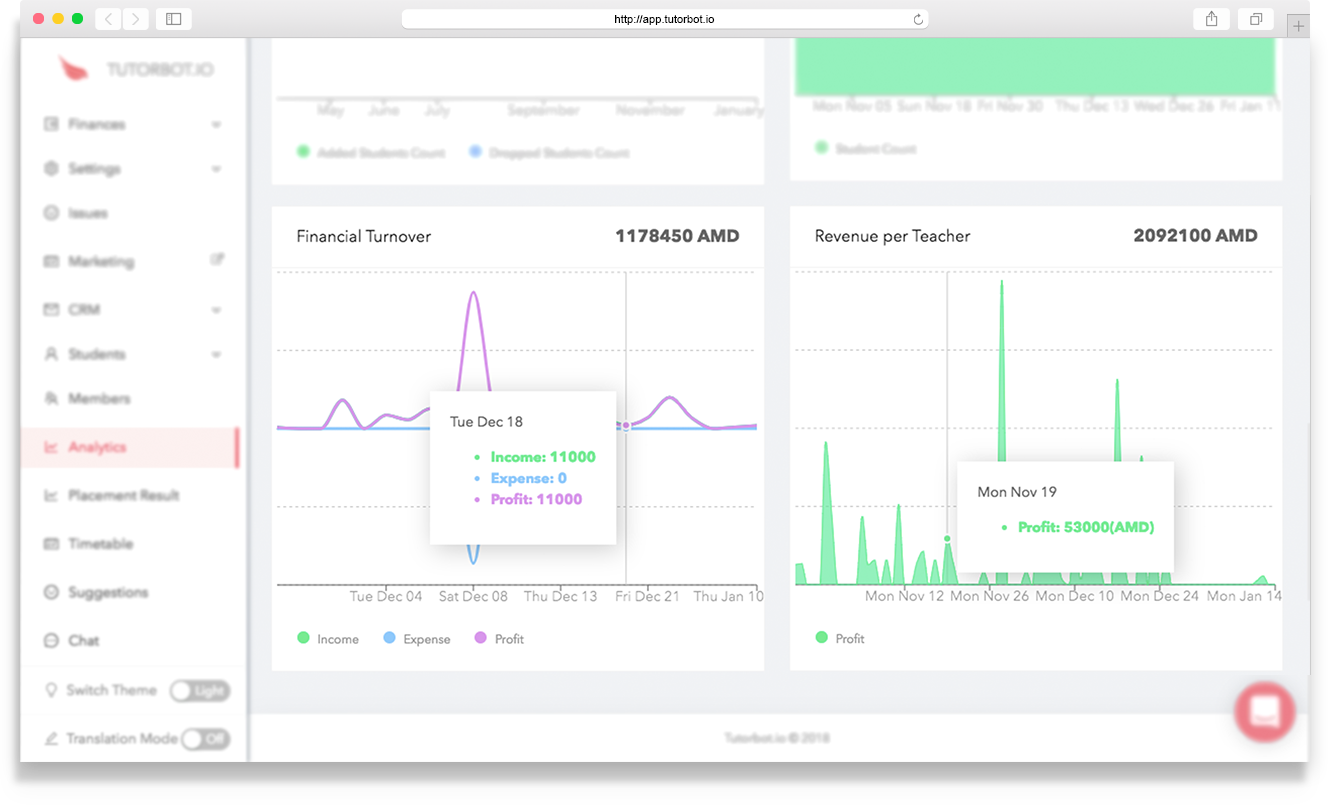
As a proof of your growth pay attention to a financial turnover and revenue per teacher. This numbers speak for themselves: The higher trend goes, the greater your school’ profitability becomes.
That was it! Measure, monitor, analyse and act according to numbers. And write us if you are not sure how to deal with numbers and which actions to take to grow your language school.
Leave a Comment